Quarterly Letter | Q2 2026
When the Margin for Error Narrows
Valuation, leverage, and a cooling economy
Markets do not decline simply because they are expensive. They become vulnerable when high expectations encounter an unexpected disappointment.
Today, several long-term valuation measures suggest that investors are paying unusually high prices for U.S. equities. At the same time, borrowing against brokerage accounts has accelerated, increasing the potential for ordinary volatility to become forced selling. Meanwhile, housing and employment data are beginning to show signs of moderation.
None of this tells us when the next correction will occur. It does tell us that this is an important time to distinguish confidence from complacency—and forecasting from preparation.
This quarter, in three observations
Valuations leave less room for disappointment. On July 17, 2026, the Shiller cyclically adjusted price-to-earnings ratio stood at 41.52. That is approximately 2.4 times its historical mean of 17.39 and roughly 94% of its December 1999 record of 44.19.
Investor leverage has accelerated. FINRA reported $1.502 trillion of debit balances in customer securities margin accounts in June 2026, compared with approximately $1.008 trillion one year earlier—an increase of about 49%.
The economy is cooling, but it is not yet breaking. U.S. payrolls increased by 57,000 in June, the unemployment rate was 4.2%, and job openings remained at 7.6 million in May. National house prices fell 0.1% in April but remained 2.0% higher than a year earlier.
Valuation is not a clock
Investors often make one of two mistakes when confronting high valuations.
The first is to ignore them because expensive markets can continue rising. The second is to treat valuation as a precise market-timing signal and withdraw from equities altogether.
Neither approach is particularly satisfying.
Valuation is generally more useful for assessing prospective long-term returns and vulnerability than for forecasting what markets will do next month or next quarter. An expensive market can become more expensive, particularly when earnings are growing and investor confidence remains strong. Current Market Valuation similarly cautions that its models are educational, long-term tools rather than short-term trading strategies.
But elevated valuations still matter. The higher the price paid for a stream of future earnings, the more dependent the investor becomes on those earnings meeting or exceeding expectations.
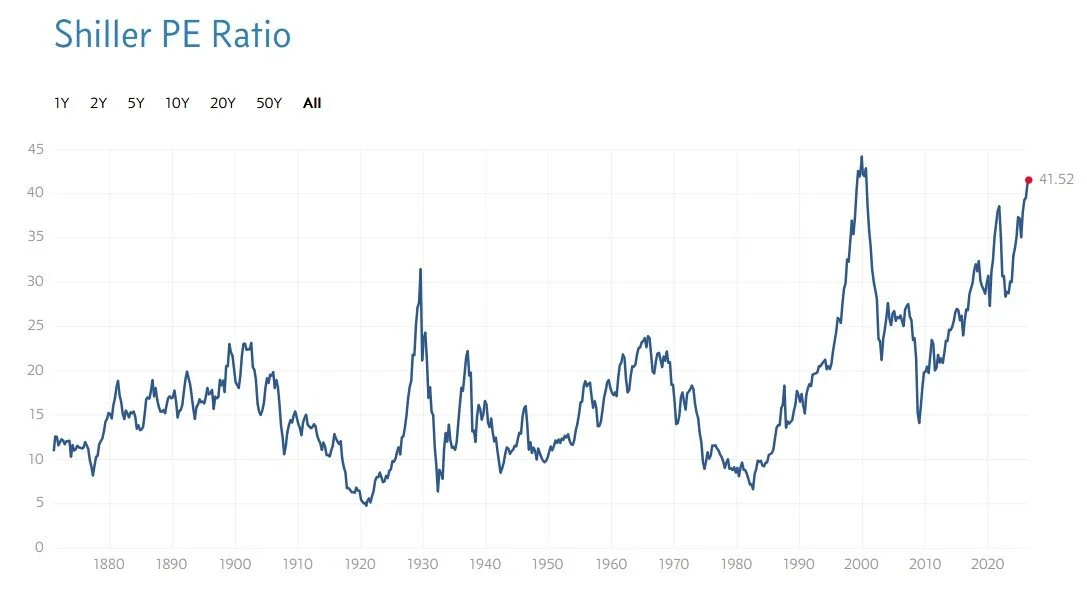
Chart: Multpl, “Shiller PE Ratio”
Annotation: Current: 41.52 | Historical mean: 17.39 | December 1999 maximum: 44.19
Chart date: July 17, 2026
The Shiller P/E, also known as CAPE, divides the current market price by average inflation-adjusted earnings over the preceding ten years. Averaging earnings across a full decade reduces the effect of temporary booms and recessions.
At 41.52, today’s reading is not merely above average. It is close to the highest level in the series, reached near the culmination of the late-1990s technology boom.
That comparison does not mean that today’s businesses, interest-rate environment, index composition, or profit margins are identical to those of 1999. They are not. Nor does it imply that a comparable decline must follow.
It does, however, suggest that a substantial amount of future success is already reflected in current prices.
Our interpretation is that investors should expect less help from further valuation expansion. Future returns may need to be earned primarily through actual growth in revenues, cash flows, and earnings. Should those fundamentals disappoint, there is less valuation support beneath the market.
Different measures, a similar message
No single valuation measure should determine an investment decision. Each has methodological limitations.
The Buffett Indicator, for example, compares the total value of the U.S. stock market with U.S. gross domestic product. It can be affected by the international revenues of American companies, changing profit margins, the composition of the public markets, and the prevailing interest-rate environment.
Even after accounting for its long-term trend, however, Current Market Valuation’s March 31, 2026 model placed the ratio at 219%. That was approximately 2.1 standard deviations above the model’s historical trend and was classified by the site as “strongly overvalued.”
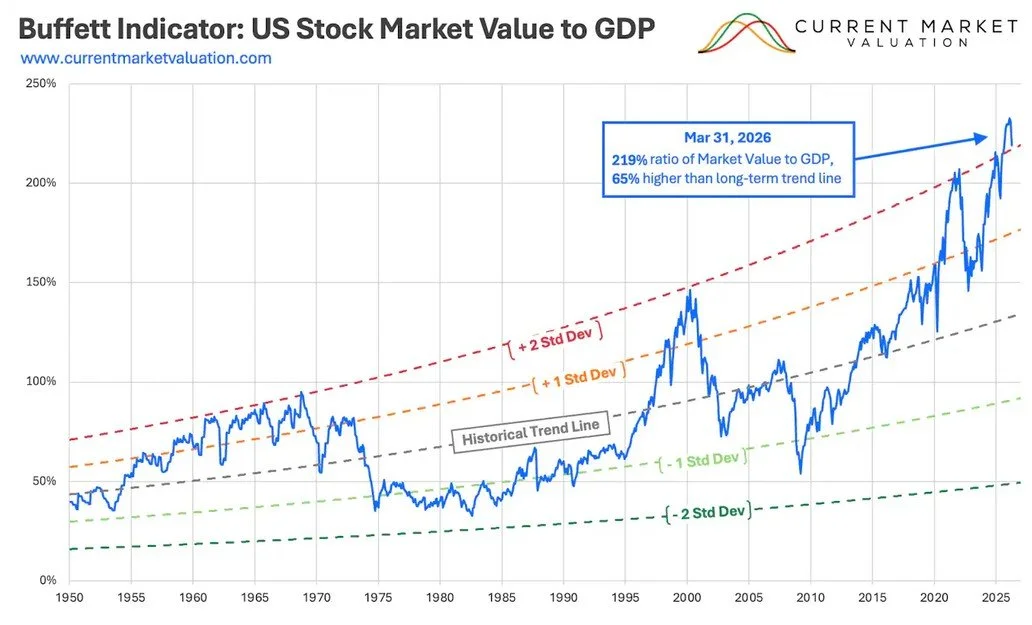
Suggested chart: Current Market Valuation, “Market Value to GDP Ratio with Standard Deviation Bands”
Annotation: 219% of annualized GDP | 2.1 standard deviations above trend
Chart date: March 31, 2026
A separate measure reaches a similar conclusion. Current Market Valuation reported an S&P 500 price-to-sales ratio of 3.0 as of March 31, compared with an average of approximately 1.8 since 2000. Its model placed that reading 2.1 standard deviations above normal.
The importance of this agreement is not that any one model is infallible. It is that several measures using different denominators—earnings, sales, and economic output—are pointing in broadly the same direction.
U.S. equities are priced for favorable outcomes.
There are also counterpoints. Current Market Valuation’s earnings-yield-gap model classified equities as fairly valued relative to Treasury bonds as of March 31. Its junk-bond-spread and volatility models were also within their respective neutral ranges. Not every indicator is signaling speculative excess, and that is one reason we do not view the current environment as a simple all-in or all-out decision.
Leverage changes the character of a decline
High valuation describes the price investors are willing to pay. Margin debt tells us something about how some of those purchases are being financed.
Margin borrowing allows investors to purchase securities with money borrowed from their brokerage firms. It can increase gains while markets rise, but it also magnifies losses when they fall.
Current Market Valuation’s February 2026 margin model reported $1.253 trillion of U.S. margin debt, an increase of $313 billion from the preceding year. After adjusting the increase for the growth of the overall stock market, its model placed the change approximately 1.12 standard deviations above its historical average.
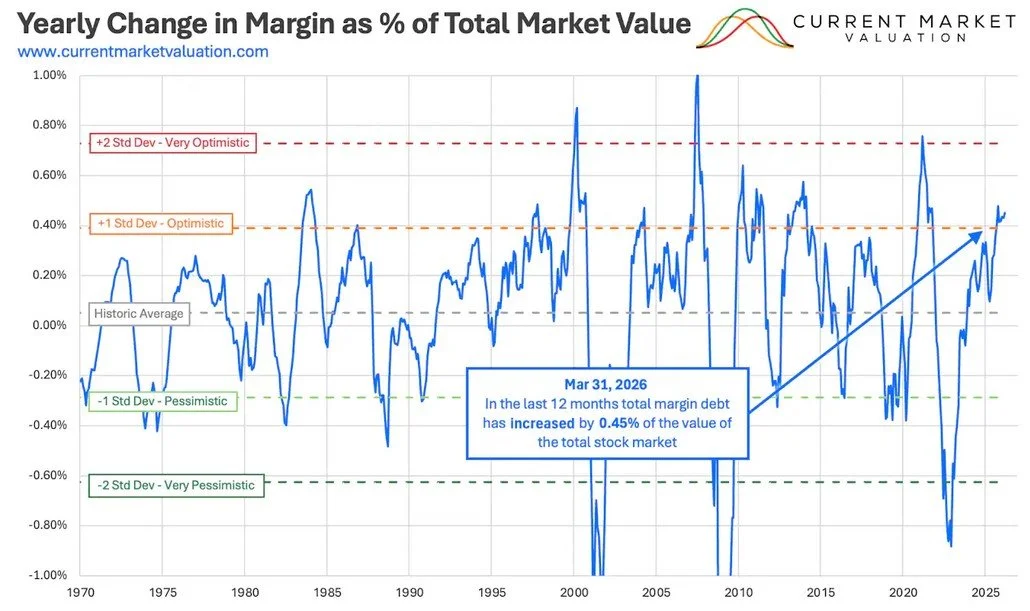
Suggested chart: Current Market Valuation, “Yearly Change in Margin Debt as a Percentage of Equity Market Size”
Primary caption: The level of margin debt naturally rises as the market grows. The rate of change relative to total market value is the more informative risk measure.
Chart date: February 28, 2026
The public Current Market Valuation chart is dated February, but the subsequent FINRA data show that the absolute amount of margin borrowing continued to rise. By June, customer margin debit balances had reached $1.502 trillion—approximately 20% above February and 49% above June 2025.
This does not prove that investors are about to sell. Leverage can continue increasing as long as markets remain favorable.
The concern is what happens after prices begin to decline.
When account equity falls below a broker’s maintenance requirement, the investor may need to contribute cash or sell securities. Brokerage firms may also raise their own margin requirements and, in some circumstances, liquidate positions without allowing the customer to select what is sold. Leverage can therefore transform a discretionary seller into a forced seller.
That distinction matters. A market populated primarily by unleveraged, long-term owners can absorb volatility differently from one in which a growing share of exposure is financed and subject to collateral requirements.
The issue is not simply that investors are optimistic. It is that some of the optimism is borrowed.
A cooling economy meets elevated expectations
High valuations are easiest to sustain when economic growth and corporate earnings continue to surprise positively. The current economic data are not uniformly weak, but the margin for disappointment appears to be increasing.
Employment
The labor market remains functional, but the pace of hiring has moderated. Payroll employment increased by 57,000 in June, while the average monthly increase during the preceding twelve months was only 36,000. The unemployment rate was 4.2%, and the number of long-term unemployed was 286,000 higher than one year earlier. Labor-force participation declined to 61.5% in June.
There are countervailing signs of resilience. Unemployment remains relatively contained, job openings totaled 7.6 million in May, and layoffs were not accelerating dramatically in the latest Job Openings and Labor Turnover report.
We would characterize this as a labor market that is cooling rather than collapsing.
Housing
Housing is sending a comparable message.
The FHFA national house-price index declined 0.1% in April, its latest monthly reading, although prices remained 2.0% above April 2025. For the first quarter as a whole, national prices were 1.7% higher than a year earlier, but eight states and the District of Columbia recorded annual declines. Prices also fell in 35 of the 100 largest metropolitan markets.
National appreciation has not disappeared. It has become slower and more geographically uneven.
That matters because housing is more than an asset price. It influences household confidence, construction activity, geographic mobility, credit creation, and consumers’ perception of their own balance sheets. A gradual normalization would be manageable. A more abrupt decline could affect spending and employment at a time when equity valuations already assume strong corporate performance.
Mixed recession signals
Current Market Valuation’s own economic models illustrate the ambiguity. Its March Leading Economic Index model showed the index at 97.30, below its twelve-month moving average of 98.27, and classified near-term recession risk as high. At the same time, its unemployment-based Sahm Rule model continued to show normal recession risk.
Economic conditions do not move in a straight line, and indicators frequently disagree around turning points. We therefore do not believe the evidence supports declaring that a recession is inevitable.
But the combination of slowing activity and elevated asset prices deserves attention. A recession is not required for earnings expectations to decline, valuation multiples to contract, or equity markets to experience a meaningful correction.
Preparation is different from prediction
The practical response to these conditions is not to build a portfolio around a single forecast.
It is to reduce the number of favorable assumptions the portfolio requires.
For investors, that begins with several questions:
Has recent appreciation pushed equity exposure above its intended policy range?
Are near-term spending needs, taxes, capital calls, or business commitments insulated from a market decline?
Is leverage present directly through margin loans, or indirectly through concentrated positions and illiquid commitments?
Does the portfolio contain investments driven by meaningfully different sources of return, or merely different labels attached to the same equity-market risk?
Rebalancing an overweight position is not a prediction that the asset will fall. It is the enforcement of a previously established discipline.
Maintaining liquidity is not an assertion that a downturn is imminent. It is a way to avoid selling long-term assets during an unfavorable market.
Diversification is not an attempt to eliminate volatility. It is an effort to prevent one economic outcome from determining the success or failure of an entire financial plan.
And avoiding unnecessary leverage is not excessively conservative. It preserves the investor’s ability to make decisions rather than having those decisions imposed by a lender.
What we are watching
In the coming quarter, we will be paying particular attention to three developments.
Earnings breadth. Can earnings growth extend beyond the relatively small group of companies currently carrying much of the market’s expectations?
Labor-market deterioration. Does slower hiring remain orderly, or does it begin to appear in unemployment claims, permanent job losses, and reduced household income?
Housing dispersion. Do price declines remain concentrated in selected regions, or do they broaden into a national contraction?
None of these indicators provides a perfect trading signal. Together, however, they can tell us whether the economy and corporate fundamentals are continuing to justify current valuations.
A narrower margin for error
Valuations may remain elevated. Corporate earnings may continue to grow. Housing and employment may stabilize without a recession. Margin borrowing may rise further before it becomes a source of instability.
We should acknowledge all of those possibilities.
But a sound financial plan should not require all of them to occur.
The central question is not whether a market correction is “due.” It is whether the portfolio remains appropriate if future returns are lower, volatility is higher, or access to liquidity becomes more valuable.
At Analog Capital Partners, our objective is not to predict every turn in the market. It is to help clients remain in control of their decisions across a range of possible outcomes.
Discipline matters most when it appears least necessary.
Analog Capital Partners