Change the measuring stick, and the market’s story changes.
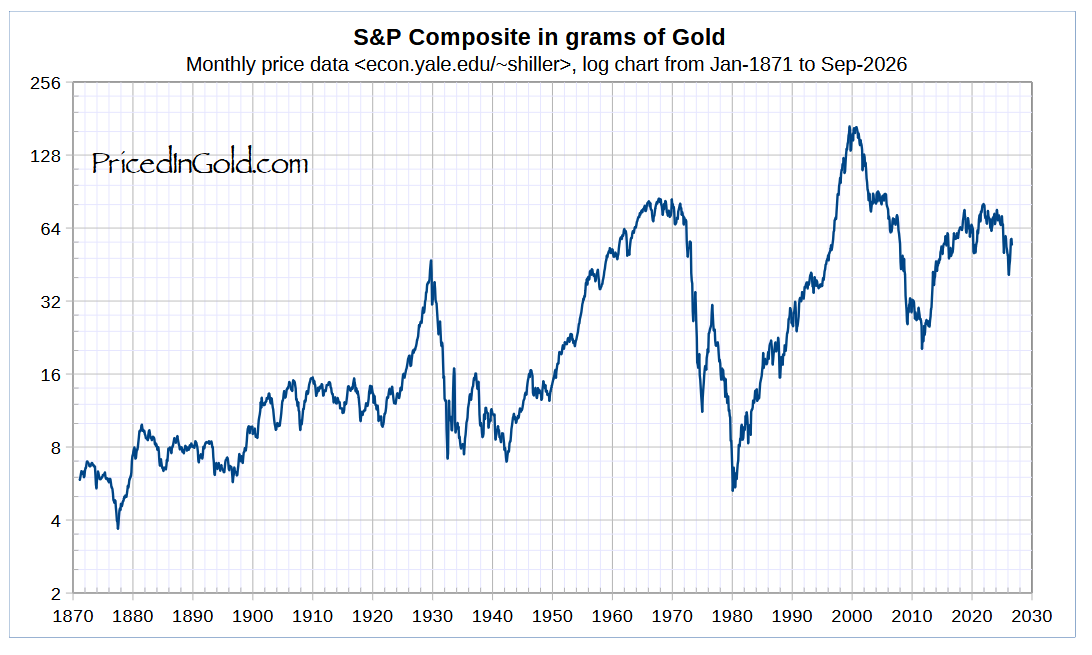
The chart above shows the historical S&P Composite measured not in U.S. dollars, but in grams of gold. Instead of a steadily rising long-term picture, we see pronounced cycles: extended periods when stock prices gained ground against gold, followed by periods when those gains reversed. Even the chart’s recent readings remain below the extraordinary peak reached around 1999–2000. These are comparisons of prices, not total returns including dividends.
That does not mean stocks are poor investments. It does not mean gold is the only reliable store of wealth. And it certainly does not tell us which asset will perform best next year.
For us, it raises a more useful question:
How much does your financial future depend on one asset class continuing to lead?