Quarterly Letter | Q3 2026
Higher Yields, Narrower Leadership: What Q3 2026 Revealed About Diversification
The S&P 500 advanced while small caps, REITs and bonds declined. Beneath the headline, the third quarter was a test of market breadth, benchmark discipline and systematic rebalancing.
The third quarter of 2026 produced a result that sounds simple until we broaden the lens: the S&P 500 gained 2.3%.
That headline was correct. It was also incomplete.
The S&P 500 Equal Weight Index declined 1.9%. Mid-cap stocks lost 6.4%, and small-cap stocks fell 7.9%. Public equity REITs declined 6.1%. The broad U.S. bond market lost 3.0%, while intermediate Treasuries were under even greater pressure as the 10-year Treasury yield climbed from 4.44% at the end of June to 5.29% at the end of September.
In other words, Q3 was positive for the capitalization-weighted S&P 500 but negative across much of the investable market.
That distinction matters. It affects how investors interpret risk, how advisors explain portfolio results, and how a diversified strategy should be evaluated. It also reinforces a recurring principle in our investment process: a headline index can tell us what the largest companies did without telling us what the average stock - or the average diversified portfolio - experienced.
Q3 in one sentence: A small group of very large companies held the headline index above water while higher long-term rates pressured small caps, REITs and bonds.
The headline index concealed a weaker market
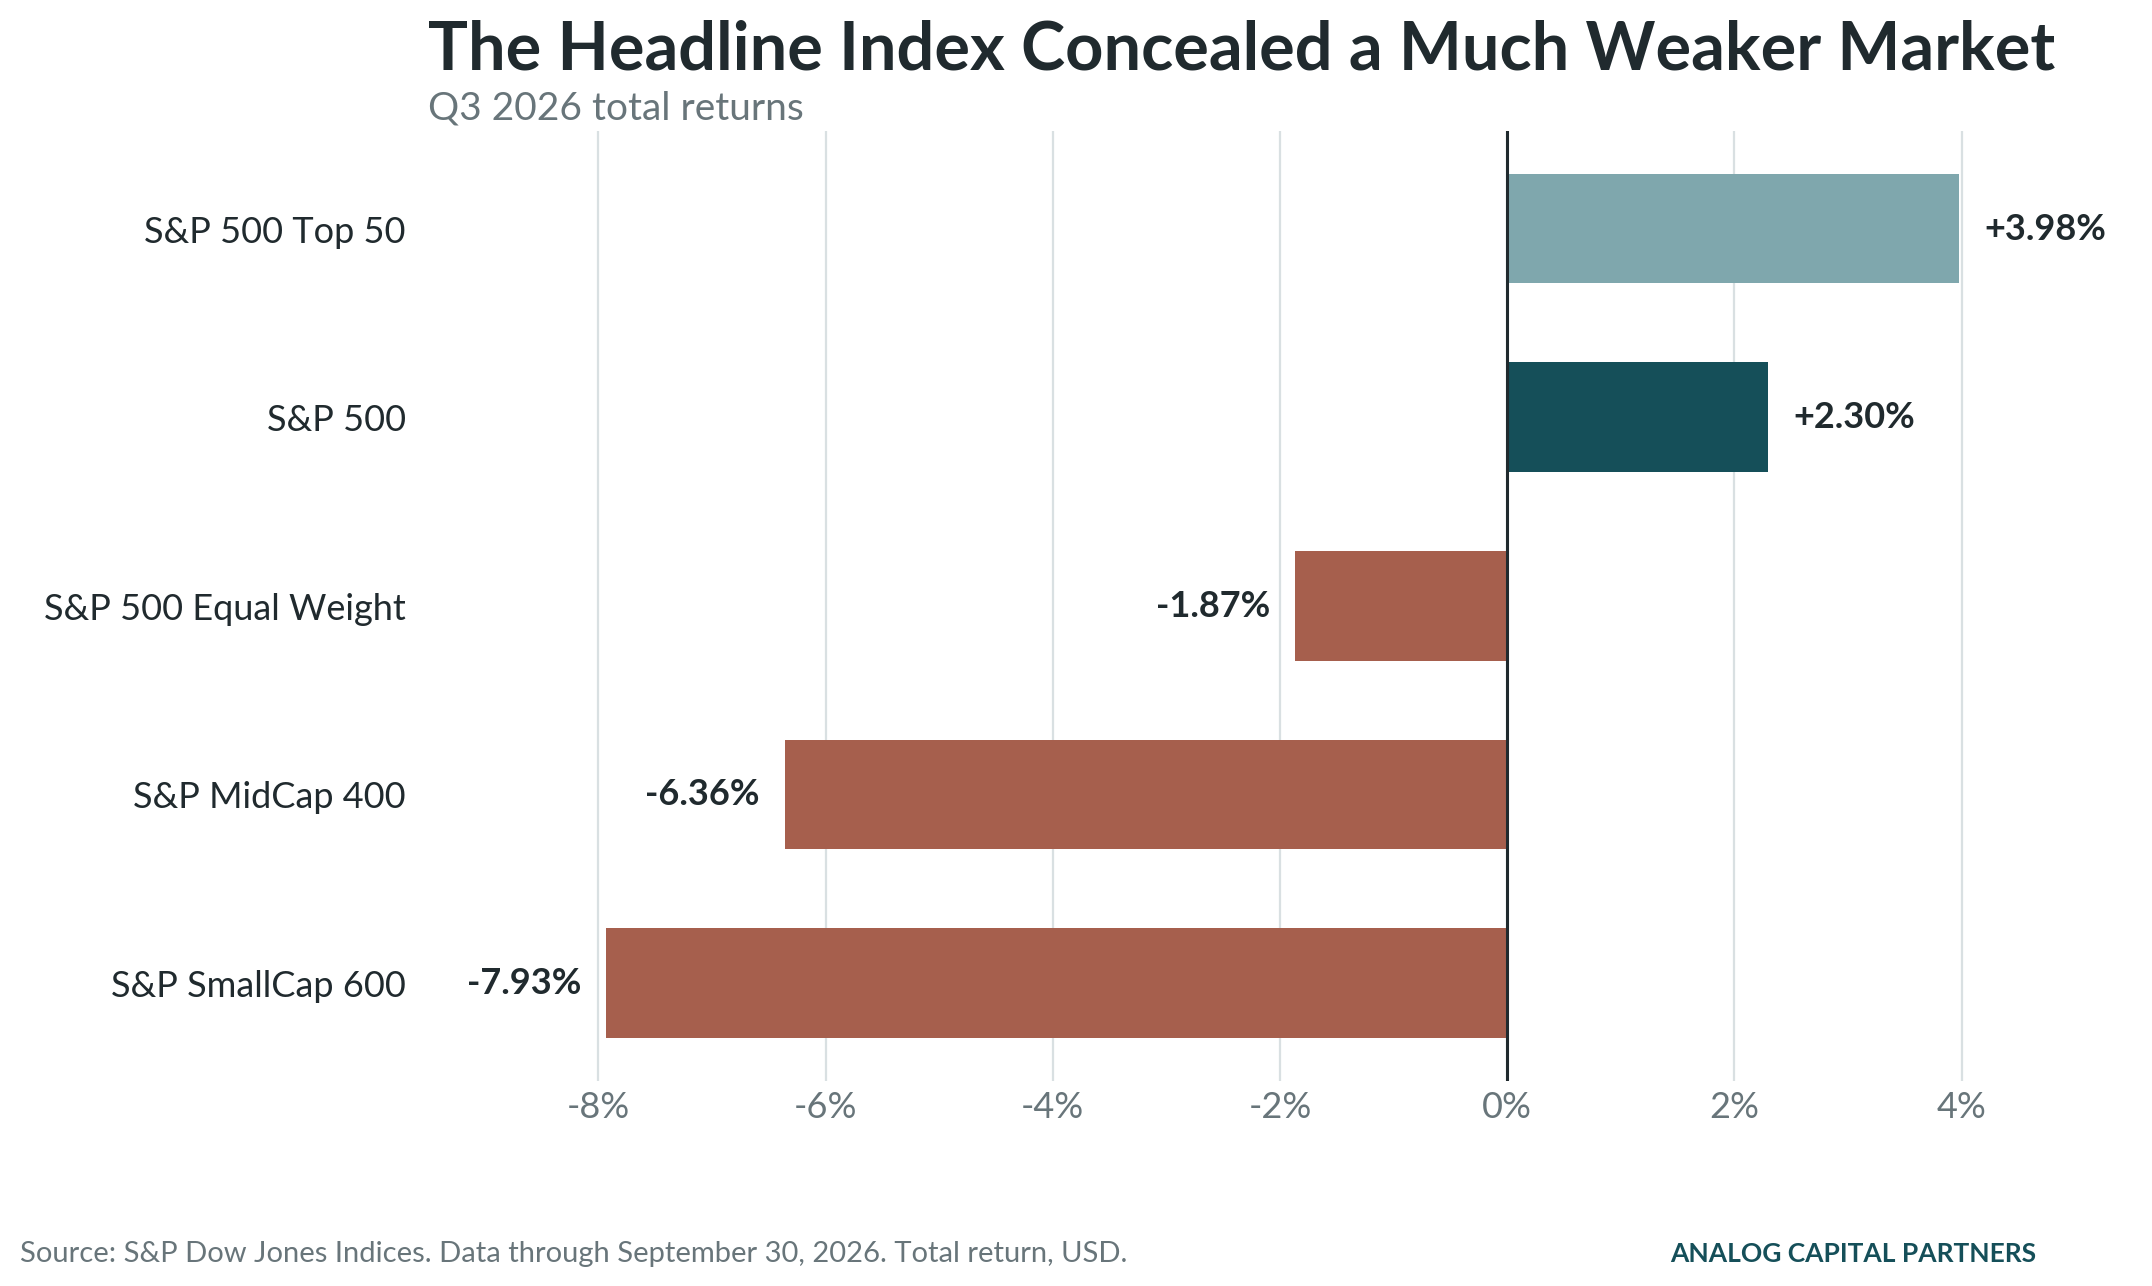
Chart 1. The capitalization-weighted S&P 500 gained 2.30% in Q3, but equal-weighted, mid-cap and small-cap benchmarks declined. Source: S&P Dow Jones Indices. Data through September 30, 2026. Total return, USD.
The S&P 500 is weighted by market capitalization. A company with a very large market value has far more influence on the index than a smaller constituent. That construction is neither good nor bad; it is simply important to understand.
In Q3, the S&P 500 Top 50 gained approximately 4.0%, outperforming the full index. Meanwhile, the equal-weighted S&P 500 - which gives each constituent the same influence - lost 1.9%. The gap tells us that leadership was concentrated among the largest companies rather than broadly shared across the index.
Our late-September breadth review offered another way to see the same divide. Roughly 430 of the 500 S&P 500 companies were below their own 52-week highs, and the average decline among those lagging companies was approximately 21%. In a related breadth analysis I shared on LinkedIn, 72.8% of S&P 500 constituents were at least 10% below their highs and 36% were more than 20% below them.
Those statistics do not mean that the S&P 500 must fall. Breadth can improve because the rest of the market catches up, or it can deteriorate because the narrow group of leaders finally weakens. Similar-looking divergences have also led to different outcomes. In 1998, the market recovered after a sharp correction. A comparable divergence near the end of 1999 preceded a much more consequential unwind.
That is why I wrote on LinkedIn that breadth is not a market-timing tool. It is a measure of participation and dependence. Sometimes the index tells us where the market is; breadth tells us how it got there.
The practical concern is not that narrow leadership guarantees an immediate correction. It is that the market becomes more dependent on a relatively small group of companies continuing to deliver exceptional results. When valuations are already elevated, that dependence narrows the margin for error.
This extends the point we made in our Q2 2026 letter, "When the Margin for Error Narrows". Valuation is not a clock. Breadth is not a clock either. Both are better understood as measures of vulnerability than as precise trading signals.
Higher long-term rates widened the pressure
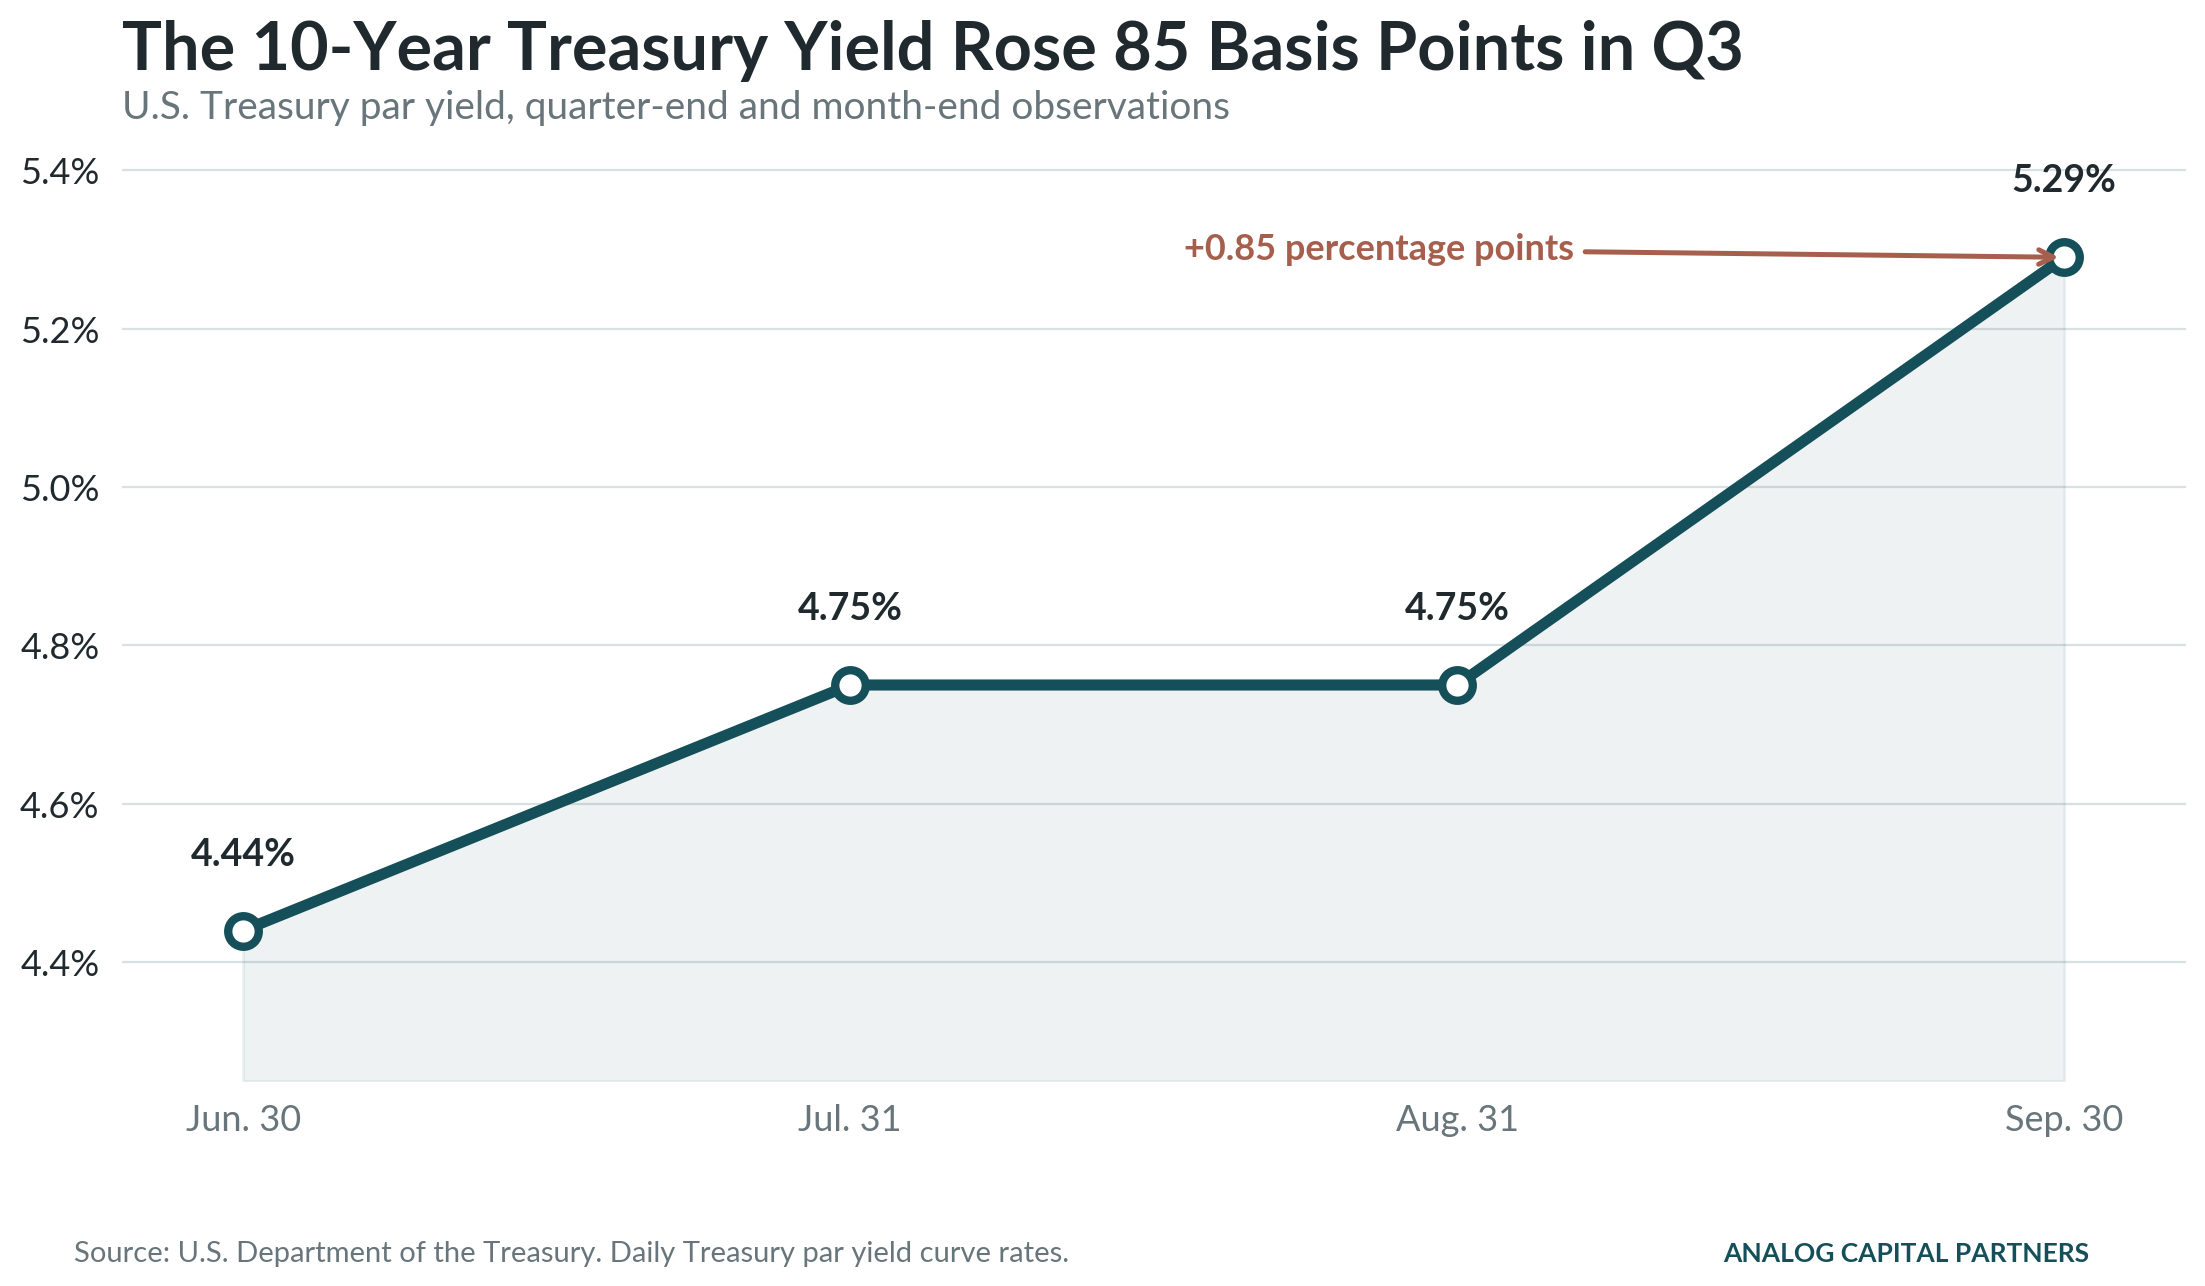
Chart 2. The 10-year Treasury yield rose 85 basis points during Q3. Source: U.S. Department of the Treasury. Daily Treasury par yield curve rates.
The other defining feature of the quarter was the rise in long-term interest rates.
The 10-year Treasury yield increased from 4.44% on June 30 to 5.29% on September 30, a move of 85 basis points. That increase affected far more than the bond market.
Bond prices generally move in the opposite direction of yields. When prevailing yields rise, the fixed cash flows from existing bonds become less attractive relative to newly issued securities, and their market prices adjust downward. The longer the maturity and duration, the greater the sensitivity can be.
Higher long-term rates also influence the discount rate applied to other assets. REITs compete with bonds for income-oriented capital and often rely on external financing. Small companies tend to face higher borrowing costs, less favorable refinancing terms and greater economic sensitivity than the largest corporations. A sharp increase in long-term yields can therefore place simultaneous pressure on Treasuries, real estate and smaller companies even though their underlying cash flows are not identical.
That is largely what happened in Q3. The broad U.S. aggregate bond index declined approximately 3.0%, an intermediate Treasury proxy lost about 4.6%, public equity REITs fell 6.1%, and small caps lost 7.9%.
The rise in rates also weighed on precious metals late in the quarter, although gold still finished Q3 with a gain of approximately 3.3%. That mixed result is a useful reminder: an asset can serve a long-term strategic role without moving in a straight line or responding perfectly to every short-term change in rates.
A difficult quarter for several diversifiers

Chart 3. Several diversifying assets declined together as long-term rates rose. Sources: S&P Dow Jones Indices, FTSE Nareit, an intermediate Treasury investable proxy and COMEX. Data through September 30, 2026.
Investors sometimes expect diversification to produce a clean offset: stocks decline, bonds rise; growth assets struggle, real assets protect; one holding disappoints, another immediately compensates.
Markets are rarely that orderly.
Different assets can share a common short-term vulnerability. In Q3, the common pressure was the rise in long-term rates. Bonds were directly affected. REIT valuations and financing conditions were affected. Smaller companies faced a more difficult cost-of-capital environment. Precious metals encountered pressure late in the quarter as real yields and the dollar moved.
This does not mean those assets serve the same purpose, nor does it mean their expected behavior over a full economic cycle has become identical. It means diversification is not a promise that every difficult quarter will contain an offsetting winner.
In our recent article, "Why Diversification Sometimes Feels Wrong Before It Works", we argued that the purpose of diversification is not to make every holding look intelligent at the same time. Its purpose is to avoid needing one part of the portfolio to be right all the time.
Q3 illustrates both sides of that trade-off. A portfolio diversified away from the largest U.S. stocks had less exposure to the narrow group that led the market. At the same time, several of its diversifiers declined together. The diversified portfolio therefore experienced the cost of not concentrating in the quarter's winners without receiving a complete short-term offset from its defensive allocations.
That can feel unsatisfying. But the right question is not whether every sleeve won during one quarter. It is whether each allocation still has a clear purpose, whether it behaved within a reasonable range of expectations, and whether the total portfolio remains appropriate for the responsibilities the capital must support.
The benchmark must match the job
A complete core portfolio should not be evaluated as though it were an equity sleeve.
The S&P 500 is an appropriate measure of large-cap U.S. equity performance. It is not a complete measure of a portfolio deliberately built with stocks, Treasuries, real assets and other diversifiers. Comparing such a portfolio only with the S&P 500 will make the portfolio look unnecessarily conservative when large U.S. stocks lead and may make it look unusually strong when stocks decline. Neither comparison, by itself, captures the intended job.
Analog Cross-Cycle Moderate is designed as a complete core portfolio. Its standing benchmark is a balanced 60/40 portfolio, not the S&P 500. More importantly, the strategy is designed to manage a broader set of risks than an all-equity benchmark addresses: market concentration, sequence-of-returns risk, liquidity needs, inflation, changes in interest rates and the possibility that the recent leader does not remain the future leader.
This does not make relative underperformance irrelevant. Advisors and clients deserve a direct explanation of what lagged, why it lagged, whether the behavior was expected and whether the long-term assessment changed.
During Q3, small caps, REITs and bonds were material sources of weakness. Their declines were understandable in the context of higher long-term rates. Their underlying portfolio roles did not disappear because they experienced a difficult quarter.
What we did: rebalance rather than forecast
Consistent with the strategic asset allocation, the Analog Cross-Cycle Moderate model bought small caps, REITs and Treasuries during the quarter as market movements took those exposures below their intended positions.
We did not make those purchases because we could identify the exact bottom. We did not abandon the strategic allocation because several holdings were temporarily unpopular. We allowed a predefined rebalancing process to restore the portfolio toward its intended construction.
That distinction is important.
Rebalancing an underweight allocation does not necessarily mean we believe it is about to surge. It means the market has changed the portfolio's risk exposures, and the process calls for bringing them back toward the policy we previously judged appropriate.
As we wrote in our diversification article, the rationale for rebalancing is discipline, not clairvoyance. It may add value by forcing the portfolio to trim relative winners and add to relative laggards, but it is not guaranteed to improve returns. An asset that has declined can continue declining. A winner that is trimmed can continue rising.
The alternative, however, is also an active decision. Allowing recent performance to determine future portfolio weights means permitting the market's latest winners to reshape the investor's risk profile.
For a Cross-Cycle portfolio, wealth preservation does not mean avoiding every negative quarter or matching the S&P 500 whenever it rises. It means reducing dependence on a narrow set of securities and one favorable economic outcome, while preserving the ability to rebalance when markets create meaningful differences in relative value.
Softer inflation and employment data changed the forward setup
The economic picture began to soften at the end of the quarter and immediately after it.
On September 30, the Bureau of Economic Analysis reported that the August PCE price index increased 0.3% from the prior month and that core PCE, excluding food and energy, increased 0.2%. Both measures were softer than the consensus estimates reported at the time. The annual readings remained above the Federal Reserve's target, so the report did not establish that the inflation problem had disappeared. It did reduce some of the pressure for an immediate additional rate increase.
Two days after quarter-end, the September employment report showed that nonfarm payrolls increased by only 29,000 and that the unemployment rate was 4.2%. The Bureau of Labor Statistics also revised July and August payroll growth lower by a combined 60,000 jobs.
The market reaction was significant. CME FedWatch probabilities cited after the report showed the estimated chance of an October rate increase falling to 13.8%, from 24.4% before the data.
These figures should be interpreted carefully. Consumer spending remained strong in August, inflation remained above 2%, and one employment report does not establish a recession. The economy may be slowing without contracting, and energy prices or fiscal concerns could keep long-term yields elevated even if the Federal Reserve becomes less aggressive.
Still, the direction of the data matters. Softer inflation, weaker job creation and negative payroll revisions suggest that the balance of risks is becoming less one-sided than it appeared when long-term yields were rising during the quarter.
What slower growth could mean for bonds and precious metals
A slower economy would not automatically benefit every diversifying asset. The mechanism matters.
For Treasuries, a sustained moderation in inflation and employment would ordinarily reduce the need for tighter monetary policy and could place downward pressure on market yields. Because bond prices move inversely to yields, that would create a more constructive medium-term environment for high-quality fixed income. The higher starting yields also mean investors are now receiving more contractual income than they were when rates were lower.
For precious metals, the relevant variables include real interest rates, the dollar, central-bank demand, fiscal confidence and geopolitical risk. If slower growth and softer inflation lead markets to expect less monetary tightening - and especially if real yields stabilize or decline - that can become supportive. But gold does not have a contractual cash flow, and its path can be volatile. It rose during Q3 but declined sharply in September, demonstrating that the medium-term thesis and the short-term price path can diverge.
REITs could also benefit from a stabilization or decline in long-term rates, but lower rates alone would not resolve every risk. Property-level fundamentals, balance-sheet quality, refinancing schedules and sector differences remain important.
The point is not that bonds, precious metals or REITs are certain to rally next. It is that the economic environment that hurt them during Q3 may be changing. Strategic portfolio construction seeks to maintain exposure before the next environment is obvious, rather than purchasing diversification only after it has already become the market leader.
That idea also connects with our article, "S&P 500 Priced in Gold: What It Shows About Purchasing Power". Changing the measuring stick changes the market's story. The useful question is not whether stocks or gold will win the next quarter. It is how much of a financial plan depends on one asset class continuing to lead.
What we are watching now
Three developments will help determine whether Q3's divergences begin to resolve or become more consequential.
1. Does equity leadership broaden?
The healthier outcome would be stronger participation from the equal-weighted index, small caps and a wider range of sectors. The more fragile outcome would be continued weakness beneath the surface followed by deterioration in the few companies supporting the headline index.
2. Does economic cooling remain orderly?
We are watching payroll growth, revisions, unemployment claims, household income, housing activity and corporate earnings. Slower growth can ease inflation and rates without becoming a recession. The distinction will matter for stocks, bonds, REITs and credit conditions.
3. Why are long-term yields moving?
A yield increase driven by stronger real growth has different implications from one driven by inflation, fiscal risk or a higher term premium. Likewise, falling yields caused by moderating inflation would be different from falling yields caused by economic stress. We care about the reason for the move, not just its direction.
Diversification is most difficult before its value is obvious
Q3 did not deliver a simple message.
It did not prove that the S&P 500 is about to decline. It did not prove that small caps, REITs, bonds or precious metals are about to outperform. It did not prove that diversification failed because several diversifiers declined together.
It showed that a positive headline index can coexist with broad weakness. It showed that long-term rates can pressure multiple assets at once. And it showed why strategic allocation requires a benchmark, a rebalancing discipline and a clear explanation of what every holding is expected to contribute over a full cycle.
For Analog Cross-Cycle Moderate, the response was to maintain the strategic construction and systematically rebalance into small caps, REITs and Treasuries as they became underweight. The objective is not to predict every market turn. It is to build a complete core portfolio that does not require one group of stocks, one interest-rate outcome or one economic forecast to remain correct indefinitely.
That is the essence of wealth preservation in a market with narrow leadership: not avoiding all discomfort, but avoiding unnecessary dependence.
Frequently asked questions
How can the S&P 500 rise when most stocks are below their highs?
The S&P 500 is weighted by market capitalization. A relatively small number of very large companies can contribute enough positive return to lift the index even while many smaller constituents decline. Equal-weighted indices and breadth measures help reveal how widely a rally is shared.
Why do Treasury prices fall when yields rise?
Existing bonds pay fixed contractual cash flows. When newly issued bonds offer higher yields, the market price of existing lower-yielding bonds generally falls to make them competitive. Longer-duration bonds are typically more sensitive to a given change in yields.
Does one difficult quarter mean diversification failed?
No, but it also does not prove that every allocation remains appropriate. Diversification does not guarantee a profit or ensure that one asset will offset another in every decline. A useful review asks whether each allocation still has a clear purpose, whether it behaved within a reasonable range of expectations and whether the total portfolio still fits the investor's objectives.
Why compare Analog Cross-Cycle Moderate with a 60/40 benchmark rather than the S&P 500?
The S&P 500 is an all-equity large-cap U.S. index. Cross-Cycle Moderate is intended as a complete core portfolio containing multiple asset classes. A balanced benchmark is more consistent with that mandate, although no benchmark captures every feature of a diversified strategy.
What does "Cross-Cycle" mean?
It describes a portfolio-construction approach intended to remain relevant across different economic and market environments. It does not mean the strategy will make money in every quarter, avoid losses or outperform every alternative.
Data notes and sources
· Equity and aggregate bond index returns: S&P Dow Jones Indices, Index Dashboard: U.S., September 30, 2026. Index performance is total return in U.S. dollars; certain fixed-income data are through September 29.
· Treasury yields: U.S. Department of the Treasury, Daily Treasury Par Yield Curve Rates.
· Public equity REIT returns: FTSE Nareit U.S. Real Estate Index Series Daily Returns.
· Intermediate Treasury return: rounded investable-proxy return based on the iShares 7-10 Year Treasury Bond ETF.
· Gold return: COMEX October 2026 gold contract quarterly change reported for September 30, 2026.
· PCE inflation: U.S. Bureau of Economic Analysis, Personal Income and Outlays, August 2026; consensus comparisons reported by Reuters on September 30, 2026.
· Employment: U.S. Bureau of Labor Statistics, Employment Situation - September 2026.
· Rate probabilities: CME FedWatch probabilities reported by Barron's on October 2, 2026.
· Breadth statistics are point-in-time observations. The approximately 430-of-500 and average-decline figures are based on Analog Capital Partners' late-September internal analysis. Additional breadth observations appeared in Billy Desai's LinkedIn post.
Important information
This article is for educational and informational purposes only and is not individualized investment, financial, tax or legal advice. Investing involves risk, including the possible loss of principal. Index returns are unmanaged, cannot be invested in directly and do not reflect advisory fees, trading costs, taxes or other expenses. Diversification, asset allocation and rebalancing do not guarantee profits, prevent losses or ensure that a strategy will outperform an alternative. Analog Cross-Cycle Moderate can lose money, trail its benchmark or an all-equity index, and experience periods when diversifying assets decline together. References to model-level portfolio activity are general, may not reflect every account and should not be interpreted as a recommendation for any individual investor. "Cross-Cycle" describes an investment approach, not a guaranteed outcome. Past performance does not predict future results.